


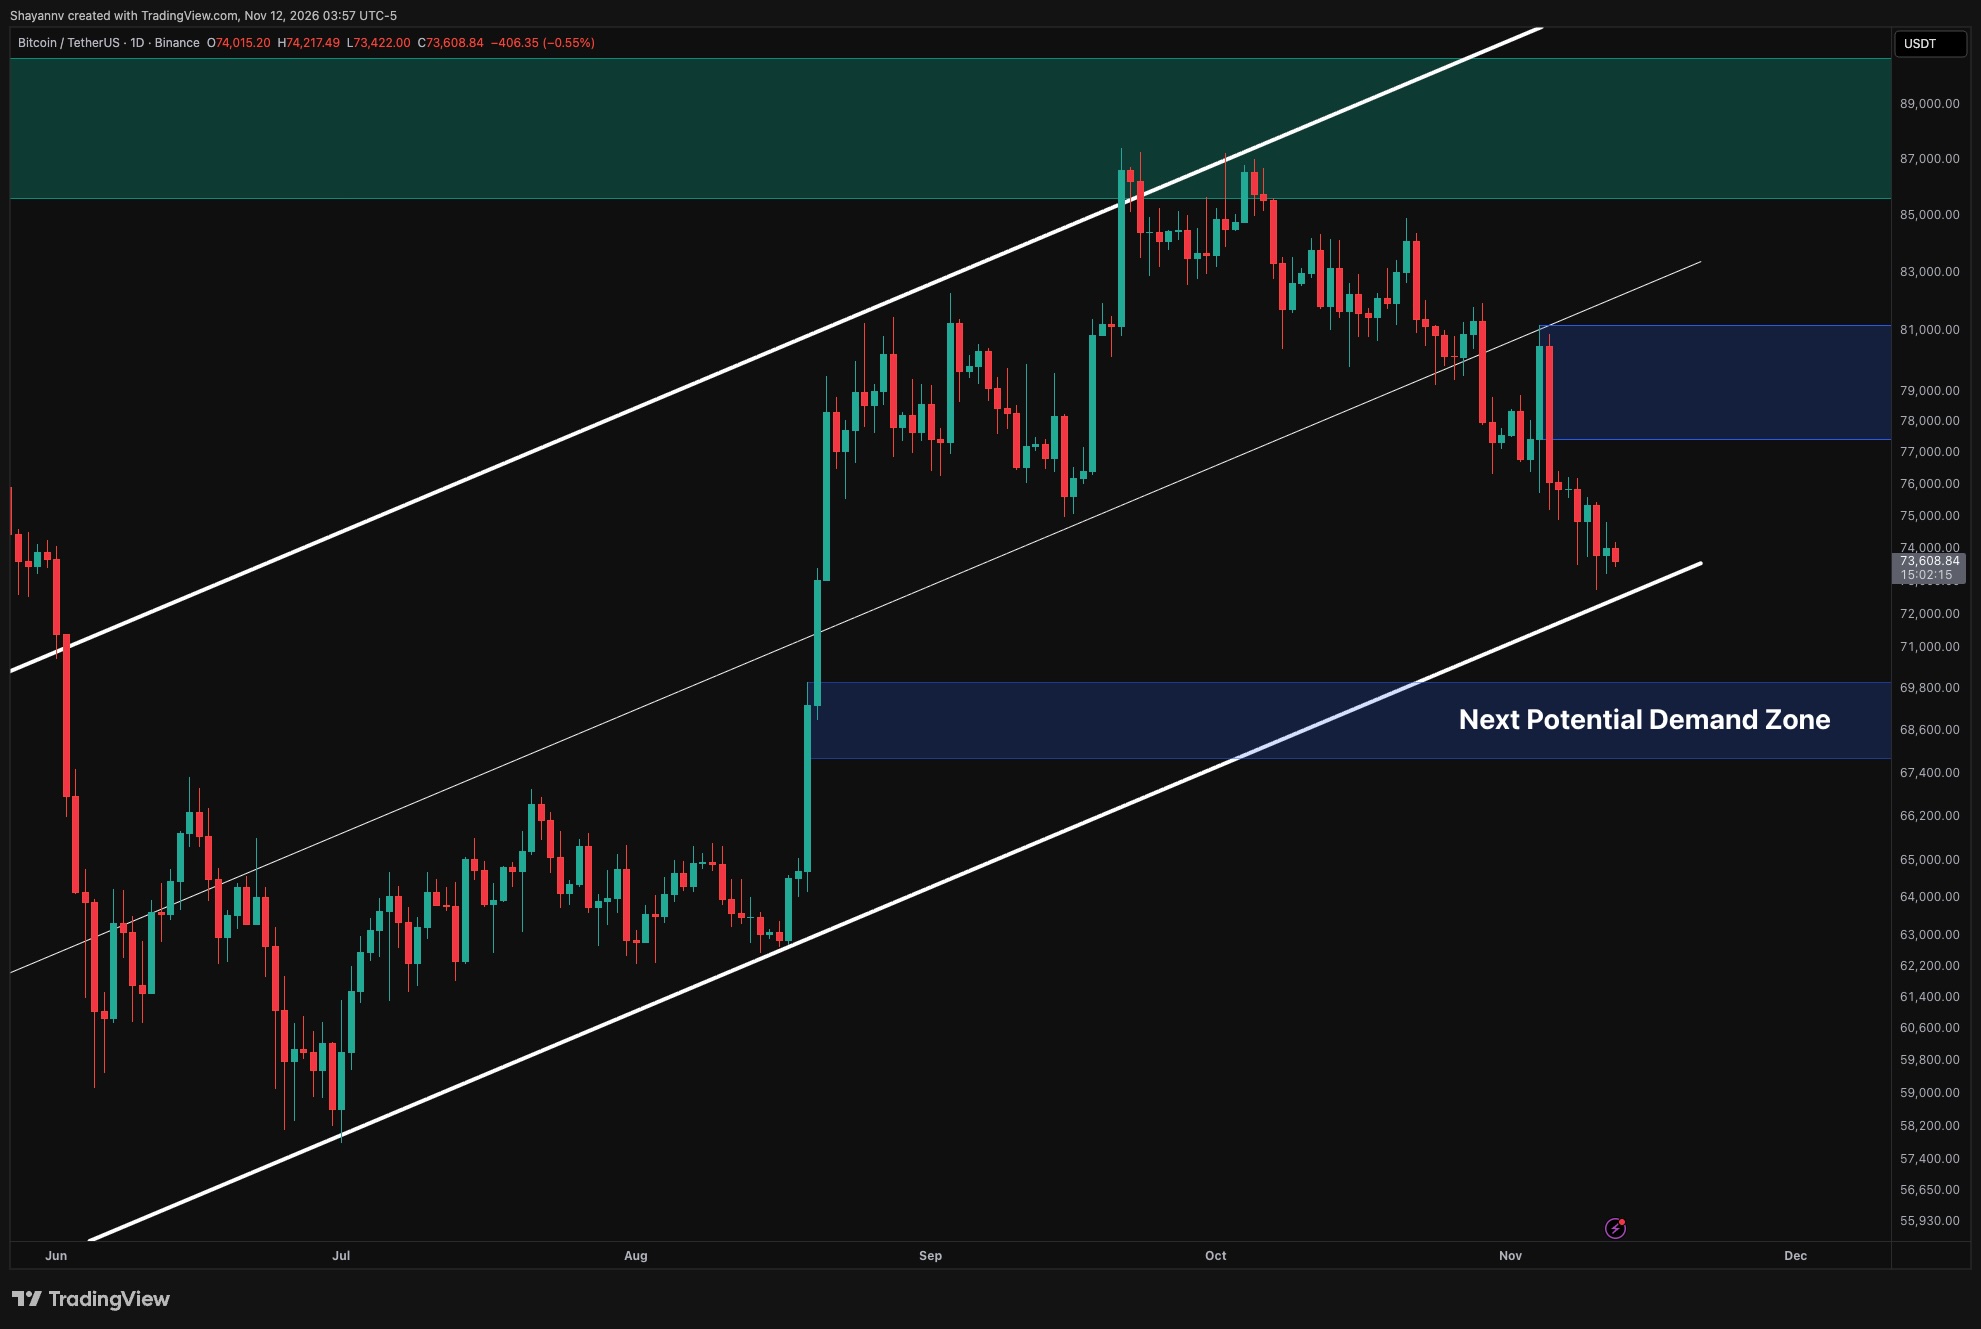
Bitcoin’s recent performance indicates a concerning trend as it approaches the lower threshold of a wider ascending channel. After a significant drop towards the $71,000 mark, market participants are responding amidst a climate of uncertainty. The current trading environment may signal potential for further fluctuations, exacerbated by disheartened buying activity and an uptick in futures trading volumes.
Technical Analysis of Bitcoin: Daily Insights
Recent daily chart analysis reveals that Bitcoin continues to create a series of lower highs and lower lows, effectively piercing through the middle of the ascending channel. Following an unsuccessful bounce towards the $81,000 level, selling pressure has intensified, pushing the price closer to the critical support area between $70,000 and $71,000.
This descending trend line represents a pivotal testing point for the overarching bullish narrative. With the latest decline bringing prices near $71,000, attempts at recovery have been lackluster. Buyers have struggled to mount a strong turnaround, placing the support along the channel’s lower boundary at risk from renewed selling pressures.
Should Bitcoin maintain daily closes below this crucial support, it may suggest deeper structural vulnerabilities, increasing the likelihood of a further downturn toward the demand zone of $67,800 to $69,800. This region is notable for its significant upward movement seen in August, serving as a vital horizontal support level on the chart.
On the bright side, Bitcoin needs to reclaim the $75,000 to $76,000 level to facilitate recovery. However, the larger supply zone from $77,400 to $81,000 remains a critical hurdle that must be overcome for a meaningful improvement in the market’s outlook.
4-Hour BTC/USDT Chart Analysis
Examining Bitcoin’s 4-hour chart indicates trading activity has fallen below the lower boundary of a descending channel. Recent efforts to recover this boundary have not been fruitful, with a newly broken trend line acting as resistance around the $74,200 to $74,500 range.
The price briefly dipped into the demand zone, estimated to be within $71,100 to $72,900, before rebounding slightly. However, buyers failed to sustain recovery above the $74,000 mark, pushing the price back to approximately $71,500. This trend continues to support a bearish market sequence, setting the stage for another examination of buying demand.
If Bitcoin’s price falls further below the recent low of around $72,700, it could delve deeper into the 4-hour demand zone, threatening the $71,000 to $72,000 area. A robust demand response is essential for reversing this downward trajectory.
Conversely, establishing a foothold by reclaiming the broken channel boundary might alleviate immediate selling pressure. Nevertheless, achieving acceptance beyond the pivotal $75,500 to $77,000 supply zone will be vital for confirming any future recovery.
Market Sentiment Analysis
The futures volume analysis illustrates heightened activity correlating with Bitcoin’s recent price decline from approximately $76,000 to $74,000. This contrasts with the relatively neutral trading activity observed during previous corrections, suggesting that futures trading has become more pronounced as prices approach local lows.
Increased trading during a downtrend could suggest a mix of aggressive selling, liquidations, or potential buyers absorbing supply. However, without additional context, these indicators do not conclusively delineate the motivations behind this surge in activity. Current observations indicate a trend toward overheating as opposed to outright overextension.
The confluence of a weak technical backdrop alongside substantial trading activity highlights that Bitcoin is approaching a critical support juncture. A confirmed breach of the daily channel boundaries, accompanied by sustained heating trends, may lead to heightened volatility on the downside. On the flip side, a robust recovery against nearby resistance levels would provide stronger indications of market absorption. While volume measurements show a spike in engagement, they have yet to support a definitive capitulation phase or a stable market bottom.
Disclaimer: Information found in this analysis is strictly based on market data and observations. It does not constitute investment advice. We advise individuals to conduct thorough research before making investment decisions. Use the presented information responsibly. See the full disclaimer for more details.
