


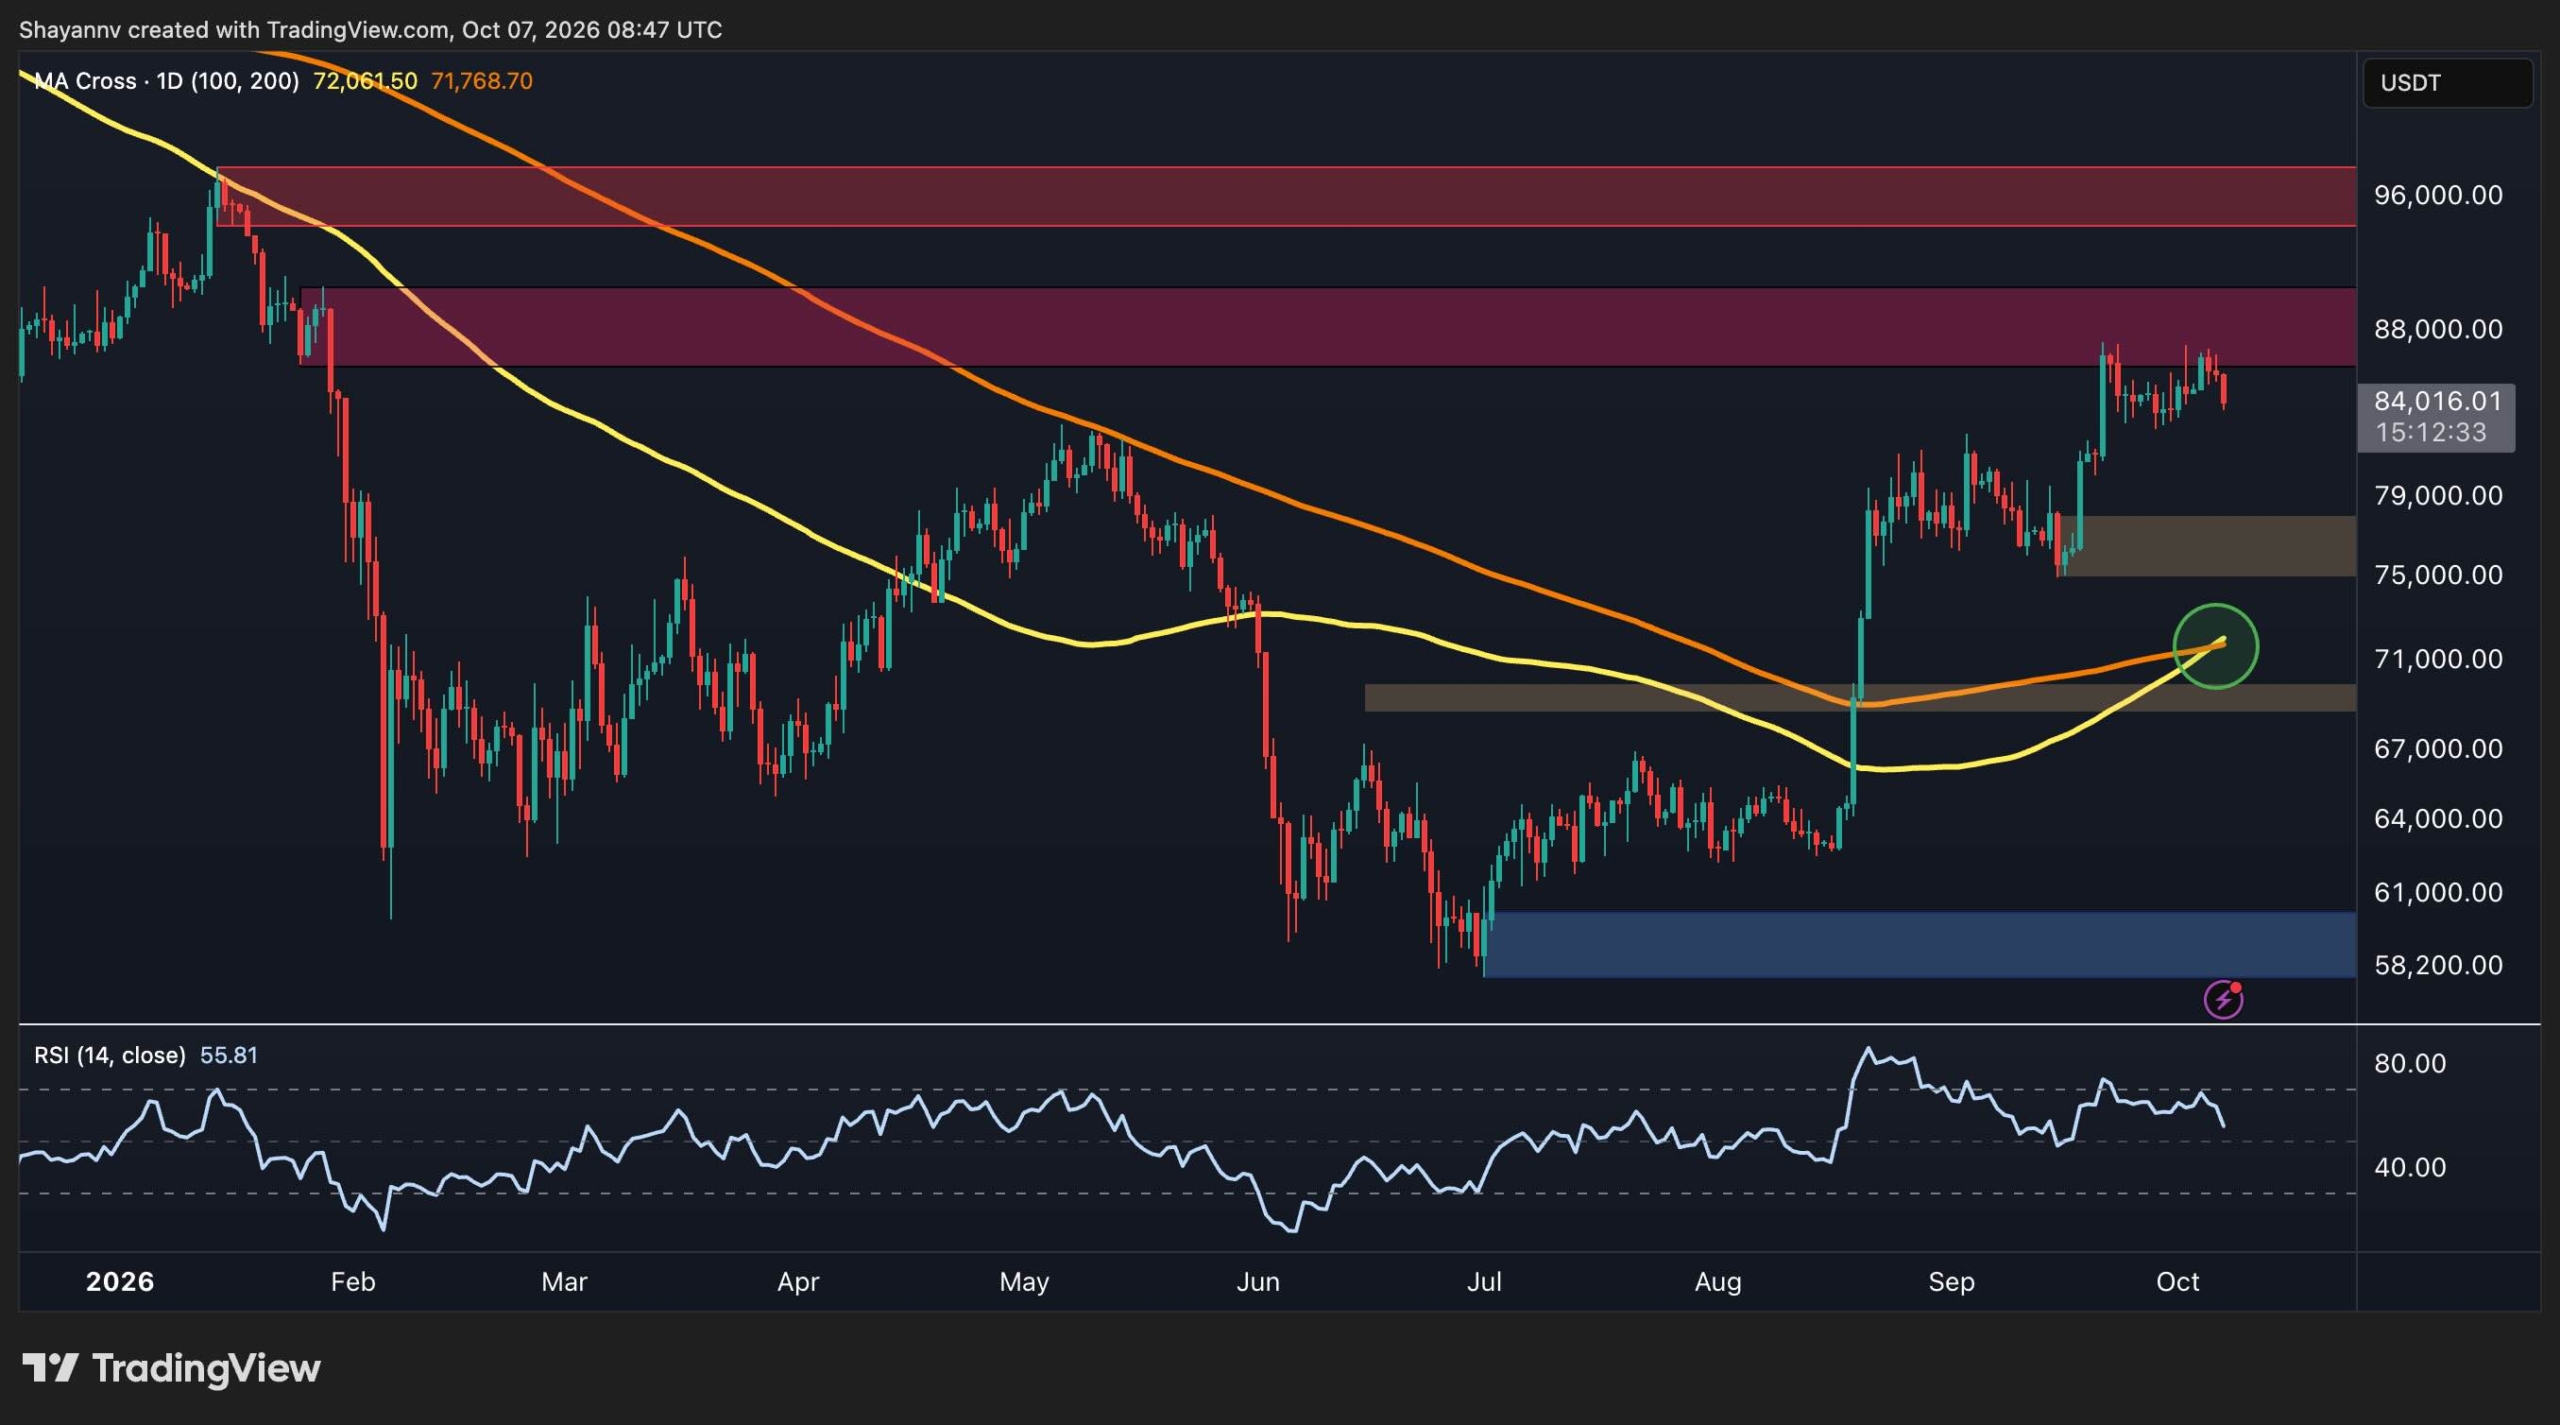
Bitcoin’s recent uptrend has hit a snag, as the cryptocurrency currently trades below $84,000, unable to maintain momentum towards the $90,000 mark. Despite this setback, the market fundamentals remain positive, suggesting that BTC might need a period of consolidation before making another attempt at a breakout.
Bitcoin Price Structure: Daily Overview
Analyzing the daily chart reveals marked structural enhancements for Bitcoin over recent months. The cryptocurrency has successfully regained both the 100-day and 200-day moving averages, currently hovering around $72,000. Notably, these averages have converged, with the short-term average now positioned above the long-term average. This bullish crossover could potentially bolster the long-term trend.
A critical demand zone exists around the $75,000 level. Maintaining the price above this threshold is essential for upholding the broader bullish recovery narrative. Nevertheless, should Bitcoin dip towards the $70,000 mark, it would still be considered part of a constructive trend, although falling below this area would significantly alter the current setup.
On the upside, Bitcoin confronts resistance within a strong supply area approximately at $88,000. The market has struggled to achieve daily closes above this level consistently. A decisive breakout past this point would open up a path to the next significant resistance zone at around $96,000.
Momentum indicators remain robust, albeit showing signs of cooling. The daily Relative Strength Index (RSI) is still above the neutral 50 mark, indicating a healthy state without yet entering overbought conditions. This suggests that momentum has not reached exhaustion levels typical of major market tops.
BTC/USDT: 4-Hour Chart Analysis
Examining the 4-hour chart reveals a more cautious perspective. Bitcoin had established an ascending triangle pattern since the lows in September, which was strengthened through multiple tests. However, the price has recently breached this trendline and is trending downwards towards the $84,000 level.
The immediate focus is on the $84,000 area. Should buyers manage to reclaim this zone and restore the broken trendline, the latest pullback could be viewed merely as a temporary setback. In such a case, Bitcoin might retest the $88,000 resistance and attempt another breakout.
Conversely, if Bitcoin continues to fall below the $84,000 mark, the likelihood of a deeper correction towards the $75,000-$78,000 range increases. This area aligns with a previous breakout and serves as the first significant support below the current trading range.
Currently, the 4-hour RSI has sharply declined to approximately 38, signaling weakened short-term momentum, bringing the price nearer to oversold territory. While this could lead to a relief bounce, it does not confirm a reversal on its own.
Market Sentiment Analysis
Current sentiment metrics illustrate some concern. The taker-buy ratio, which compares aggressive buying to selling, is hovering just below 1 at approximately 0.994, a significant decline from its peak in September. This indicates a reduction in aggressive buying pressure as Bitcoin approaches the $88,000 resistance level.
Importantly, the taker-buy ratio has been on a downward trend since its peak in August, despite Bitcoin’s relative price stability. This divergence suggests that the recent price advancements have not been matched by a consistent increase in active futures demand.
While this trend does not necessarily forecast an imminent bearish reversal, a successful breakout past $88,000 would carry more weight should the taker-buy ratio begin to recover. A rise in this ratio above 1 accompanying a price breakout would signal a return of buyer strength in the market.
