


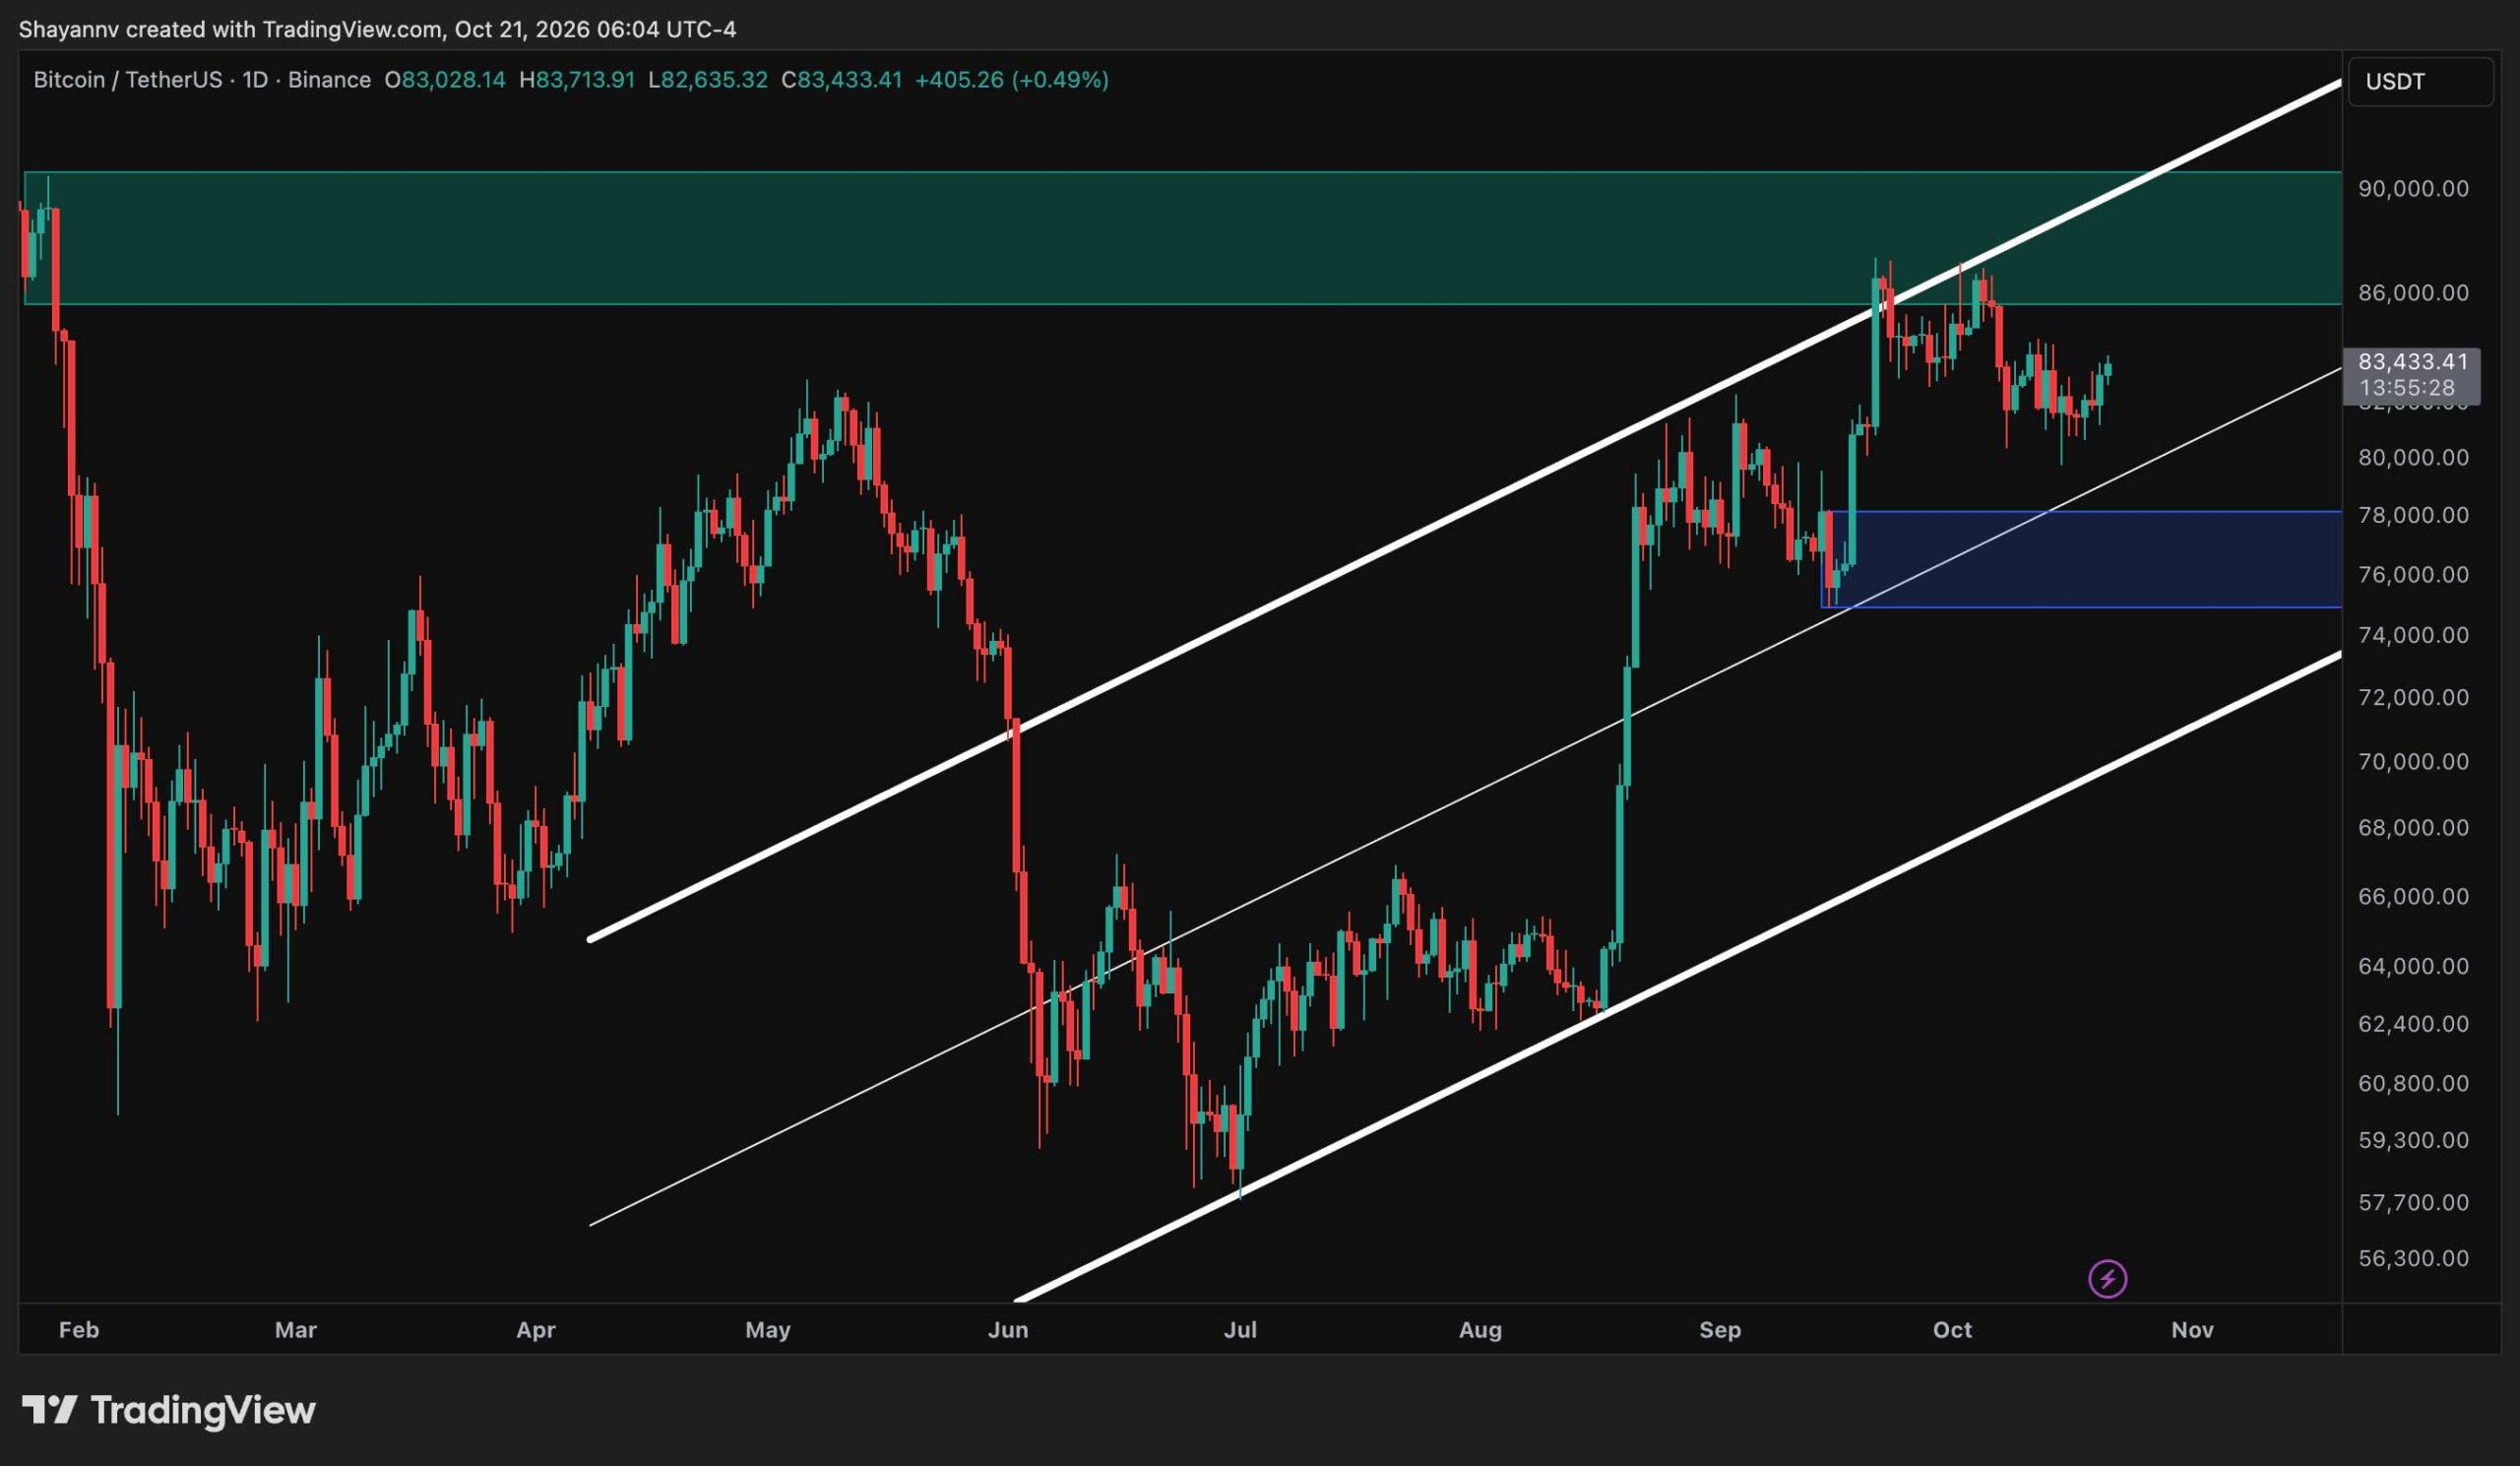
Bitcoin’s price is currently hovering around $85,000 as it recovers from a recent dip, finding support at the short-term demand threshold of $80,000. This rebound comes amid market speculation, estimating about a 25% probability of the Federal Reserve raising interest rates at their forthcoming meeting in late October, which follows a quarter-point hike in September.
Current Bitcoin Price Trends
The cryptocurrency continues to display resilience within an ascending channel, a structure established since late June, when it reached lows around $58,000. Price fluctuations have pushed Bitcoin toward a crucial supply zone between $86,000 and $90,000—an area where a decline commenced in February. Attempts to surpass this zone have seen prices touch $87,000, only to be met with downward pressure subsequently.
Maintaining the upward trajectory hinges on Bitcoin closing above the midpoint of the channel, currently around $80,000. A decisive daily close over $86,000 would signal a breakthrough into the supply zone, potentially paving the way to $90,000. Conversely, if the midpoint is breached, the attention would shift to the $75,000-$78,000 range, which served as the foundation for the September bull market. Further loss could take prices down to the lower boundary of the channel, expected around $72,000, marking the critical support line before validating the recovery channel.
4-Hour BTC/USDT Chart Insights
Analyzing the 4-hour chart reveals Bitcoin’s performance within a short-term uptrend channel originating from its mid-September lows close to $75,000. After peaking at $86,000 on October 6, the price has been forming lower highs. However, each decline has found support at the established $80,000 demand zone, now coinciding with the lower trendline of the channel.
Currently, Bitcoin is testing the $84,000-$84,300 supply zone, which was established after prices peaked on October 12. A successful breakout above this level could signal an end to the short-term downward trend, suggesting a move towards the $85,600-$86,600 area, aligning with the prices prior to the drop on October 6. On the flip side, a failure to maintain above $84,000 may result in a revisit of the $80,000 demand zone, and breaching both this level and the lower trendline would activate concerns over a drop to the $75,000 zone, reaffirmed in daily analyses. Nevertheless, the formation of higher lows on the 4-hour chart hints at a valid opportunity to surpass $84,000.
On-Chain Analysis Using the NVM Ratio
In assessing the on-chain metrics, CryptoQuant’s NVM Ratio offers insights into Bitcoin’s health by comparing its market capitalization against the square of its daily active addresses. This model aligns with Metcalfe’s Law, suggesting that a network’s value escalates with the number of users engaged.
Currently, the 30-day exponential moving average (EMA) of this ratio has peaked above 4.5 during Bitcoin’s ascent to an all-time high in 2025, with a notable rise to about 4.4 in January 2026, before it dramatically fell towards $65,000 in February. After a decline to around 3.0 in August, this indicator has now rebounded to nearly 4.1, despite Bitcoin trading at only a fraction of its peak value.
This increase in the NVM Ratio should not be viewed as an immediate sell signal. Factors such as the shift of Bitcoin activity to off-chain custodians and ETFs may inflate this ratio over time. Nevertheless, the upward trend in the NVM suggests that price valuations are growing increasingly detached from actual network usage, highlighting the necessity of maintaining the $80,000 demand zone in the near future.
Disclaimer: Information found on CryptoPotato is that of the cited writer. It does not represent CryptoPotato’s opinion on whether to buy, sell, or hold an investment. We recommend that you do your own research before making any investment decisions. Please use the information provided at your own risk. See Disclaimer for more information.
