Bitcoin has consistently exhibited a recognizable pattern over a four-year cycle. Currently positioned two years into this cycle, investors are keenly observing market indicators and trends to discern what lies ahead in the coming years. This article explores the framework of Bitcoin’s four-year cycle, reviews past market behaviors, and speculates on future developments.
Understanding the Four-Year Cycle
The four-year cycle of Bitcoin is significantly influenced by the halving event, which occurs every four years and cuts the block rewards for miners by half. This halving mechanism decreases the influx of new Bitcoins into circulation, often setting off supply-demand dynamics that can elevate prices.
This phenomenon is clearly illustrated through the stock-to-flow model. This model juxtaposes the current supply of BTC with its inflation rate, estimating its “fair value” in comparison to tangible assets like gold and silver.
As we find ourselves in the midst of this cycle, we could be heading into a phase characterized by rapid growth, following the initial recovery period that usually follows halving events.
Reflecting on 2022
Back in 2022, Bitcoin experienced a significant downturn, triggered by multiple corporate failures. The crisis peaked in November when bankruptcy rumors led to a drastic drop in stock prices, culminating in the collapse of FTX. This triggered a ripple effect, causing the demise of other crypto giants like BlockFi, 3AC, Celsius, and Voyager Digital.

During this tumultuous time, Bitcoin’s value dropped from approximately $20,000 to $15,000, mirroring the widespread panic in the market and raising concerns about Bitcoin’s longevity. However, Bitcoin has since rebounded significantly, rising fivefold from its lows in 2022. Investors who persevered through the downturn were rewarded, reinforcing the notion that Bitcoin’s cyclical nature remains intact.
Shared Sentiments
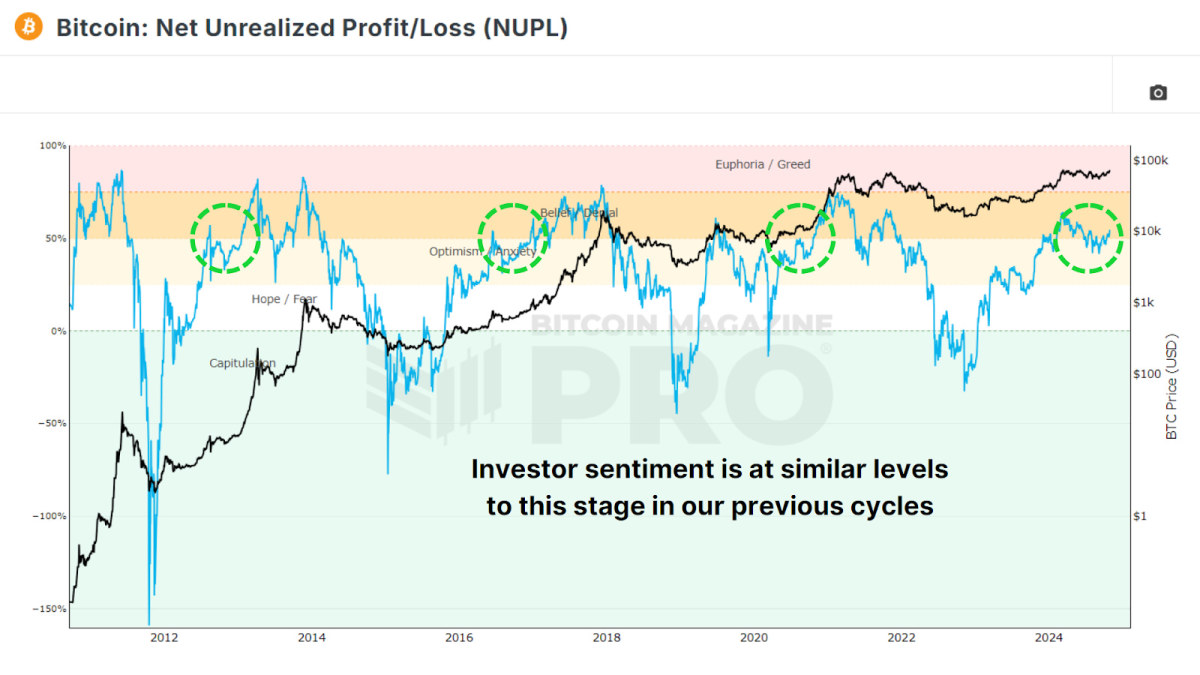
Beyond just price behavior, the emotions of investors also tend to follow a recognizable pattern throughout each cycle. An examination of net unrealized gains and losses (NUPL), a measure that reflects unrealized profits and losses in the market, indicates that feelings of euphoria, fear, and resignation recur in cycles. Typically, Bitcoin investors experience significant fear and negativity during bear markets, eventually transitioning back to optimism as prices recover. Currently, after a phase of adjustment and leveling off, we are entering the “belief” stage once more.

The Global Liquidity Cycle
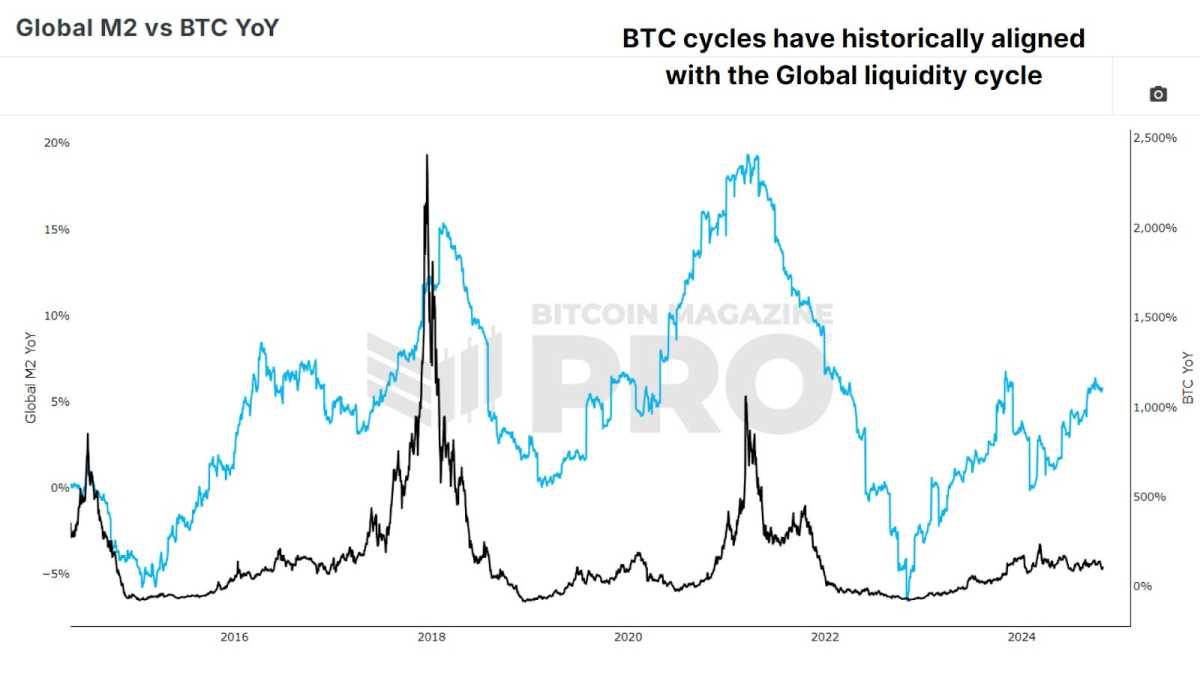
The worldwide money supply and liquidity, represented by the Global M2 year-over-year fluctuations and Bitcoin’s performance, also adhere to a four-year cycle. For instance, M2 liquidity saw its lowest points in 2015 and 2018, coinciding with Bitcoin’s dips. In 2022, M2 again reached a trough, aligning perfectly with Bitcoin’s bear market bottom. Following such economic contractions, we often witness an expansionary fiscal response from central banks and governments, creating a more favorable scenario for Bitcoin’s valuation to rise.

Recurring Patterns
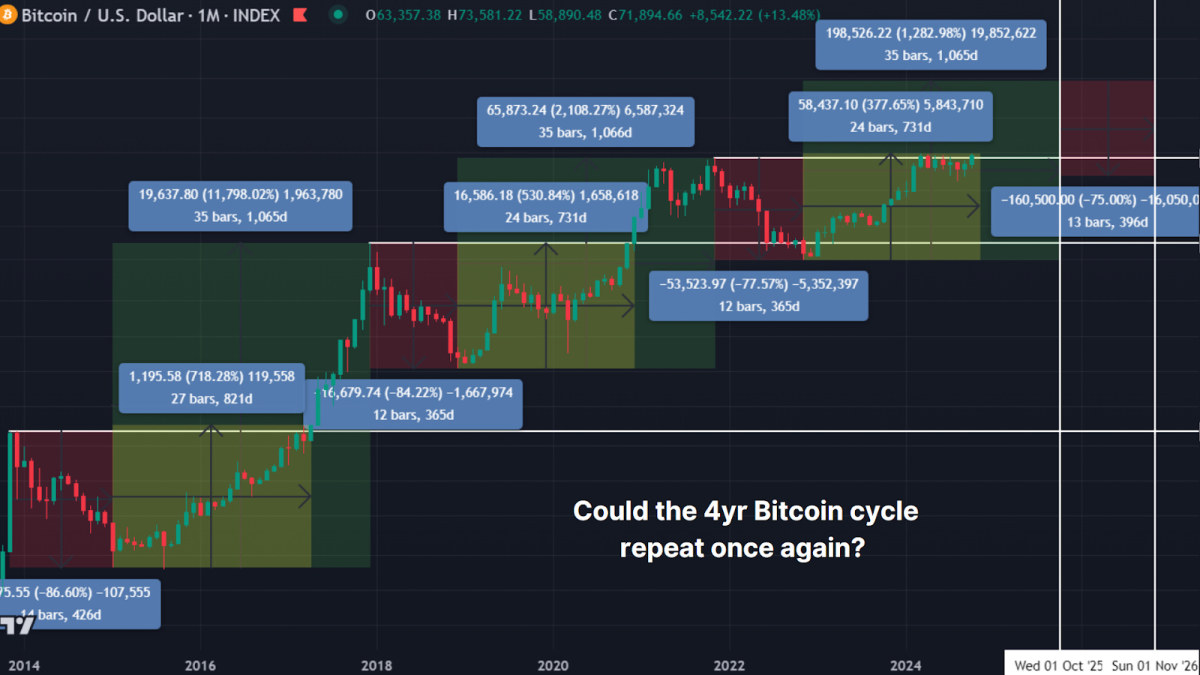
Analysis of Bitcoin’s market history reveals that its current path closely mirrors previous cycles. Historically, Bitcoin takes around 24 to 26 months to ascend from its lows back to previous peaks. The last cycle lasted 26 months, and in this cycle, Bitcoin has mirrored a similar upward trend over the previous 24 months. If the historical pattern holds, we might expect substantial price increases until around October 2025, after which a new bearish phase may commence.
Looking back at past trends, we can anticipate that after the expected market peak, Bitcoin will likely slide into a bearish phase in 2026, lasting nearly a year before commencing a new cycle. While these trends are not definitive, they offer a potential roadmap for investors to navigate and adjust to upcoming market conditions.

Final Thoughts
Despite various hurdles, Bitcoin’s four-year cycle persists largely due to its supply mechanics, global liquidity conditions, and investor sentiment. As such, this cycle serves as a crucial tool for understanding potential Bitcoin price movements. Nonetheless, relying solely on this cycle may overlook critical insights. By integrating on-chain analytics, liquidity evaluations, and current investor sentiment, a comprehensive, data-driven strategy can better equip investors to adapt to shifting market dynamics.
If you’re interested in expanding your knowledge on this topic, check out our latest YouTube video: The 4 Year Bitcoin Cycle – Halfway Complete?


