


The Ethereum price (ETH USD) has fallen below the psychologically important $3,000 level, and the Ethereum price trend is currently in a fragile price action zone after a sharp decline. At the time of writing, ETH is trading around $2,900-2,950, down about 5-7% in 24 hours, while its market cap has fallen towards the mid-$340 billion range.
The move comes after around $600 million in leveraged crypto positions were shed in one day, with traders bracing for a potential spike in volatility caused by institutional flows mixed with weak technicals.
GM fam
Yesterday, BTC fell below $86,000, resulting in over $600 million in liquidations. The main factor was risk aversion ahead of the Bank of Japan’s interest rate decision.
We are in extreme fear right now. Here we slow down and analyze.
Some notes:
– Avoid multiple open positions… https://t.co/dNK0Cw3ULO pic.twitter.com/Ac3ysOjsLe—Kapoor Kshitiz (@kshitizkapoor_) December 16, 2025
Why did the price of Ethereum suddenly drop below $3,000?
For new readers, Ethereum is the second largest crypto network by market capitalization and is the backbone of DeFi, NFTs, and most tokenization projects. When ETH breaks through a major price level, it tends to ripple throughout the market.
According to economic timesduring a widespread liquidation event that wiped out about $592 million in crypto leverage, Ethereum’s price fell by about -6.9% to about $2,904. This slide reportedly further extended an already fragile structure that began in November when Ether lost support at $3,590 on 138% above-average sales volume. coin desk.
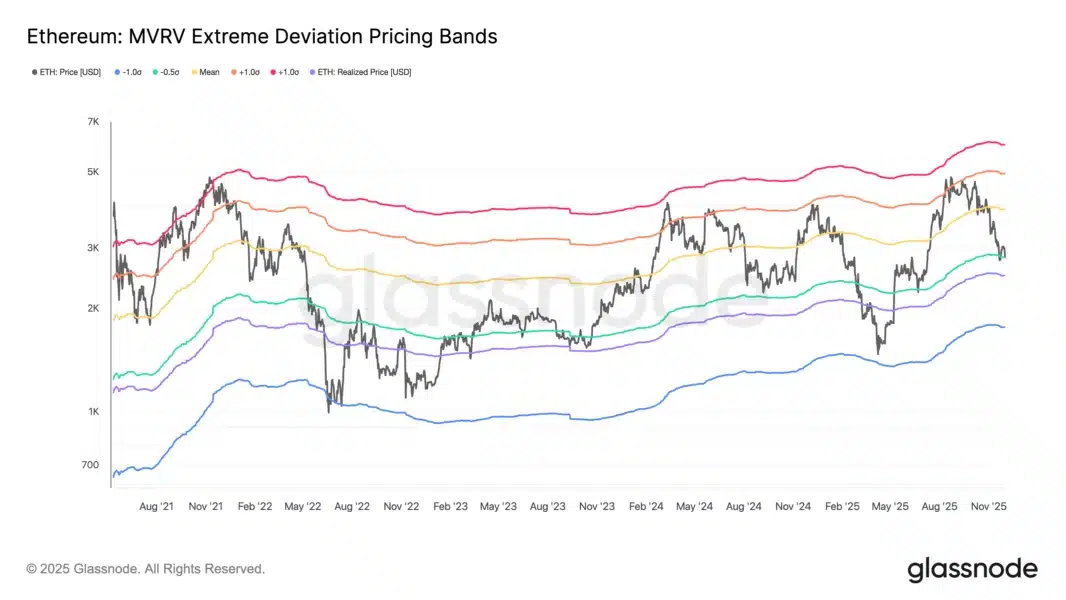
Short-term traders are closely monitoring the $2,820-$2,830 zone, with the MVRV deviation band repeatedly acting as a kind of on-chain shock absorber.
Since 2016, the best time to accumulate Ethereum $ETH is when the MVRV Z-score is below 0.
Currently it is 0.29. pic.twitter.com/HVyGxE8bQF
— Ali Charts (@alicharts) November 26, 2025
Cointelegraph notes that this band has been a recurring pullback area in recent weeks, suggesting that some participants still see value accumulating there even though broader sentiment has turned cautious. On the intraday chart, Ethereum price is currently trading below $3,000 and its 100-hour simple moving average, with a clear bearish trend line limiting any recovery attempts near $3,120.
(Source – TradingView, CoinTelegraph)
This is not happening in a vacuum. The rebound and liquidation of Bitcoin itself is dependent on the correlation of Ethereum, and this theme is similar to the wipeout of BTC. Ethereum and institutional investor demand. At the same time, increasing competition from alternative chains like Solana and the growth of narratives surrounding rival smart contract ecosystems are driving some speculative capital away from ETH during the risk-off period.
Discover: 15+ Coinbase Listings to Watch in 2025
How does this Ethereum price breakdown shape volatility and market structure?
The immediate question for traders is whether this sub-$3,000 range is a springboard or a trap. Technically, resistance is currently centered around $2,980, $3,050, and $3,080-$3,120. A decisive move above this band could pave the way back towards $3,175-$3,200.
However, if it fails to recover $2,980 and $3,000 with volume, ETH could fall towards $2,920 and even $2,880-$2,840, with $2,800 emerging as a key downside line.
24 hours 7 days 30 days 1 year Always
Structurally, this drawdown highlights the extent to which Ethereum continues to rely on leveraged futures flows and macroeconomic risk appetite. The US-traded ETH ETF recorded outflows of approximately $578 million in August 2025, indicating that some financial institutions are tactically reducing their exposure. A invest.
But in parallel, the launch of JPMorgan’s MONY tokenized money market fund on Ethereum highlights that blue-chip institutions continue to build on the network even as prices fluctuate. business insider.
In terms of competition, liquidity is fragmented. As we discussed in our coverage, some of the capital has turned to faster-moving stories and altcoins. Setting up altseason and ETH breakout and wider Bitcoin and Ethereum price prediction under rising risks.
If ETH fails to defend its current on-chain support zone, the “Ethereum as a safe large-cap stock in DeFi” narrative could temporarily weaken, giving rivals more room to market themselves as higher betas.
Discover: 16+ new and upcoming Binance listings in 2025
What are the real risks for Ethereum traders right now?
The central risk is assuming that a break below $3,000 automatically guarantees a quick snapback. Hourly indicators remain bearish. The MACD for ETH/USD is still gaining momentum in the red and the RSI is below 50, reflecting sellers in control rather than capitulation exhaustion.
A liquidation is already underway and a second wave of forced selling could occur if the price loses the support between $2,920 and $2,880.
There are also narrative risks. While Ethereum’s on-chain metrics still show solid usage and institutional experimentation, the price is sending a more cautious message. Recent coverage of the “worst ETH bull market” and competitive threats. Ripple targeting the Ethereum marketwhich can amplify fear when the technicals are already weak.
For investors, distinguishing leveraged price movements from long-term structural health is important in determining whether this is a buying opportunity or a signal to reduce risk.
For now, volatility risk goes both ways. A clean recovery and hold above $3,080-$3,120 would suggest the current move was a leveraged flush within the larger range, while a daily close below $2,880 would strengthen the possibility of a deeper correction.
Until the chart makes its choice, disciplined position sizing, clear invalidation levels, and an honest view of the period are more important than trying to call an exact bottom.
Discover: Top 20 Cryptocurrencies to Buy in 2025
For the latest market updates, join the 99Bitcoins News Discord here
The post Ethereum falls below $3,000 as liquidation spikes and volatility looms appeared first on 99Bitcoins.